...
Build Progress Graphical View
You can view the build output in graphical view by clicking the Graphical View tab in the Build Progress window.
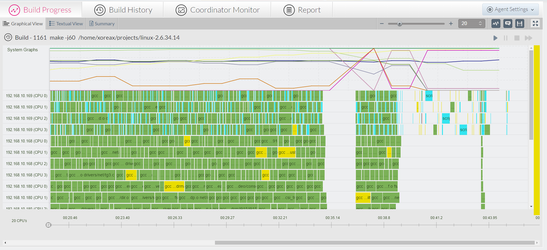
The Graphical View is divided into two sections:
- System Graphs - top pane
- Build Progress Graph - bottom pane
The Build Progress - Graphical View also has a vertical Build Status Bar along the right edge of the screen.
The Graphical View display offers the following features:
...
| location | top |
|---|
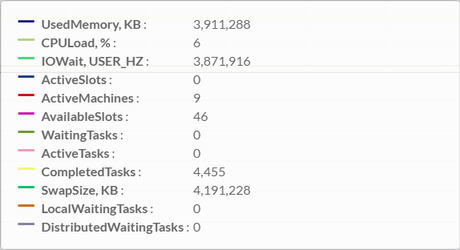
System Graphs
The System Graphs show overall information of the system during the run of the selected build, according to the following color coding:
- Black - used memory
- Bright green - CPU load
- Turquoise - IO Wait
- Blue - active CPU cores
- Red - active machines
- Purple - available CPU cores
- Olive - waiting tasks
- Pink - active tasks
- Yellow - completed tasks
- Dark green - swap size
- Orange - local waiting tasks
- Gray - distributed waiting tasks
Hovering over the System Graph shows the system information at any point of time during the build:
Showing / Hiding the System Graphs
You can click the Show/Hide System Graph toggle button to show/hide the Systems Graph.
Build Progress Graph
The Build Progress Graph illustrates how tasks are distributed between the Agent machines (CPUs) over time. The time axis displayed below the graph is the time that has elapsed from the beginning of the build. Clicking the clock icon on left side of the time axis will toggle between relative time and absolute time. T
he Build Progress Graph provides developers with the ability to have an intuitive graphical representation of their execution process, quickly locate errors and warnings, see the execution duration of each task, find performance bottleneck and retrieve detailed information on every task that is executed as part of the build process.
Hovering on a task block displays the following information on the process:
- Process ID - the id of the process in the system.
- Process Name - the name of process that is spawned by IncrediBuild.
- Task ID - the id of the task, as it appears in the build's processes table in the DB.
- Exit Code - the exit code of the process.
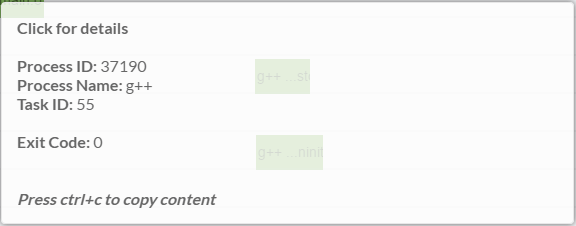
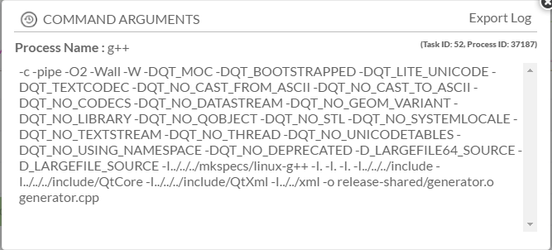
Clicking on a task block displays more detailed information:
- Process Name - the name of process that is spawned by IncrediBuild.
- Command Arguments - the list of command arguments.
- Task ID - the id of the task, as it appears in the build's processes table in the DB.
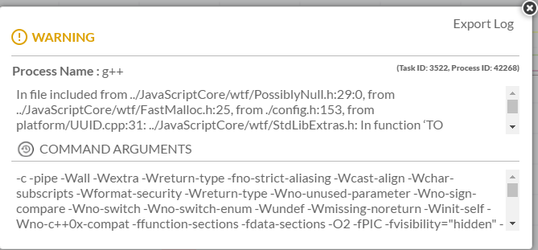
- Warnings / Errors - when applicable, it shows the StdErr of the process, both for warnings and errors:
Block colors
Each colored block represents a single task in the build. The various colors represent the various task statuses.
- Blue - in-progress task
- Aqua - successful task that can only be executed locally on the initiating machine
- Green - successful task that can be distributed to remote machines
- Yellow - task with stderr that exited with exit code 0 (possibly warning)
- Red - task which exited with non 0 exit code (possibly error)
Build Status Bar
The vertical status bar along the right edge of the screen is colored according to the status of the build. The colors indicate the following:
- Green - Build completed successfully, without warnings.
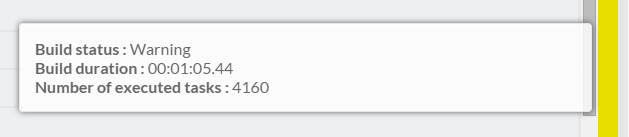
- Yellow - Build completed successfully, with warnings.
- Red - Build failed or was aborted.
Hovering over the Build Status Bar displays a detailed description of the build status.
Zooming Into / Out of the Graphs
The Zoom In/Out feature enables you to focus on specific areas of the graphs in the Graphical View.
There are several ways to zoom in/out of the graph:
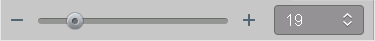
- Move the slider bar to the right to zoom in; to the left to zoom out.
OR - Click the + at the right end of the slider bar to zoom in one unit at a time; the - at the left end to zoom out one unit at a time.
OR - In the Zoom Level box, type the desired zoom level, or use the up/down arrows to increase/decrease the zoom level.
The System Graphs and Build Progress Graph are reduced or enlarged, according to the zoom level selected.
If you want to see more agents in the progress-screen, use the 'zoom out' option in your web browser and set it to 50% (or less), then click the refresh button.
Full Screen View
You can display the Build Progress Graphical View, Textual View, or Summary in full screen view.
To display Build Progress in full view:
- In the toolbar, click the Full-Screen View button
.
Click the button again to return to normal view.
...
| width | 20 |
|---|
...
| align | left |
|---|
Monitoring Your Build:
| Child pages (Children Display) | ||||
|---|---|---|---|---|
|
IncrediBuild for Linux Guide:
...